Miller Welding
Miller Welding, an ITW company, was planning to launch a new product in the fall of 2017, and they needed help. The interface for their new welder was as yet undecided, and internal disagreement was getting them nowhere. There was no outside testing protocol in place, and the only decision they'd made was that it would have a LCD screen.
Preliminary research was conducted by Leede Research in Minneapolis, MN, with the aid of myself and the Project Manager. They interviewed 14 welders local to the Minneapolis area to conduct qualitative research among Miller and other competitive large frame welders to determine preferred welder display and user experience features. Interviews were conducted on-site at local welding shops, over a period of two weeks. At the end of the study, Leede presented a wireframe concept and process flow that they felt would meet the requirements of the average welder. At the end of the study, Leede presented a wireframe concept and process flow that they felt would meet the requirements of the average welder.
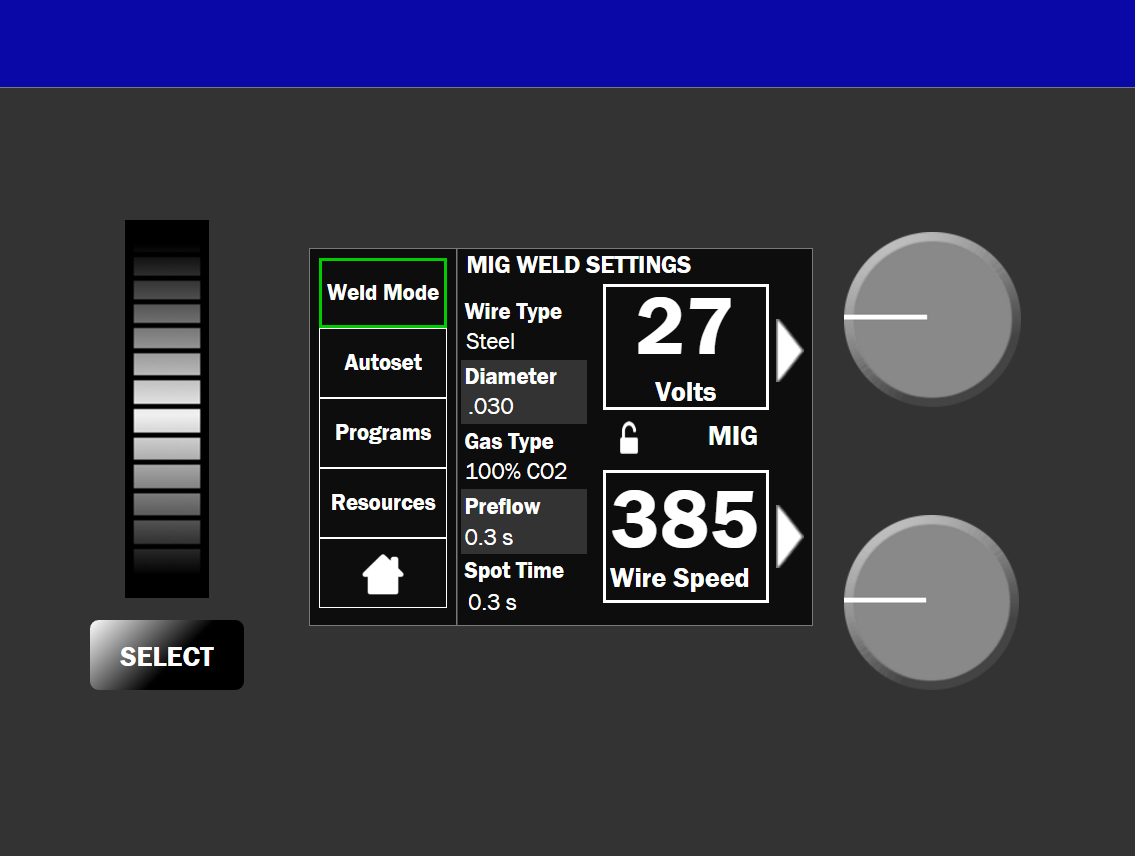
Miller project managers were dissatisfied with the provided prototype, however, and I was tasked with completing the research. I received a potential prototype from Miller internal sources, and created one additional prototype for testing.

These three wireframes were then turned into functional, HTML-based interactive prototypes, using Axure prototyping software. I also designed a testing protocol for the remainder of the user interviews. Recruiting was done by Miller project managers, according to criteria that we jointly decided on. The criteria included that participants must have a least a year of welding experience, be familiar with welding protocols, be employed as either a welder or welding manager, and work in a certain set of fields.
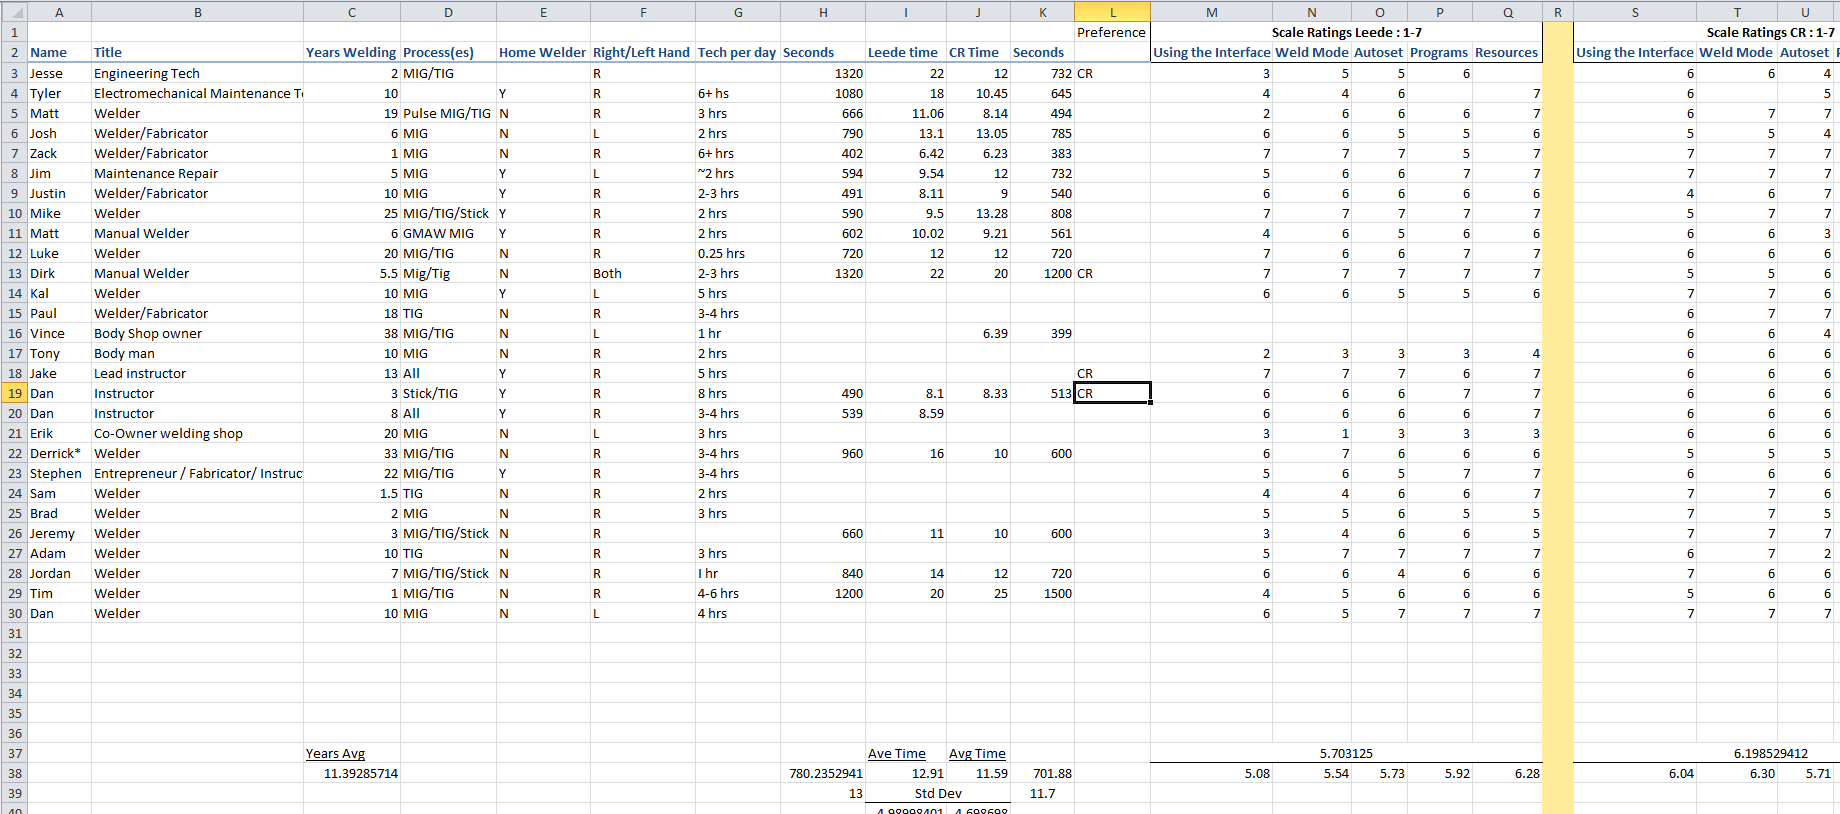
Participants were shown one of the three interfaces, labeled Concept CR, Concept Leede, and Concept D. Concept D was only tested twice, and due to low satisfaction scores and technical difficulties, it was removed from testing. The remaining interfaces were shown to users, alternating which concept was shown first to decrease bias. A testing script was used which explained the tests, outlined the procedure, and took participants through a series of four tasks. The amount of time it took participants to complete tasks was noted, as were tasks which the participants failed to complete without assistance.

The tasks were the same for each interface, and the questions asked were identical for each test. At the end, follow-up questions were asked, centered on perceived difficulty, and user satisfaction. Users were asked what they liked, disliked, would keep, and would change about the interface they had just interacted with. They were also asked if they would want to use this welding interface every day.
A total of 30 user tests were conducted over the course of three weeks. At the end of the test, the results were organized, and regressions were run on the numbers to try to findcorrelations. Participant comments were pulled for inclusion in the report, and common themes were recorded.

A final report was delivered, detailing the findings of the study. The most strongly-performing interface was analyzed, and recommendations for changes were made. Additionally, a list of features which should not change was included. Merits of the poorly-performing interface were also included, for future development.
The project continues on, with plans to institute changes to the strongest interface. The interface will then undergo another round of testing before the final decision is made.
Return to projects